The analysis example below contains the evaluation of MOL BUBI services over a five-month period. The data is for a timeframe between 2015.01.01. 31.05.2015. Our aim was not preparing a comprehensive study but with the use of our tools to demonstrate the main cornerstones of what we can do in the fied of analytical work and data visualization.
All demonstrative examples on this site are based on our analysis submitted for the MOL Bubi –SZTAKI - BKK Data Analysis Competition. The analysis published herein are under authority of BKK and publication is with their permission.
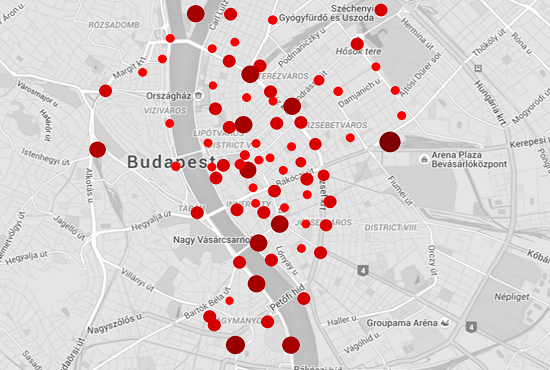
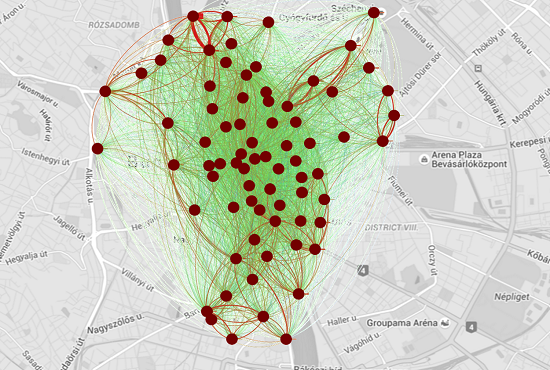
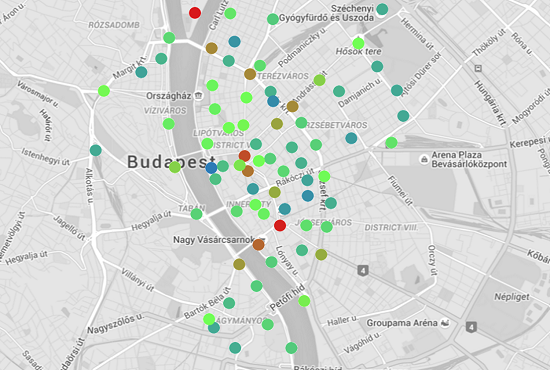
Dense access to public bikes in the city center
Budapest's city center area is the main hub of public bike stations and have a dense cover, so that of the stations are on Pest side. The right map shows the location of these stations, and also highlights the capacity of a particular station.
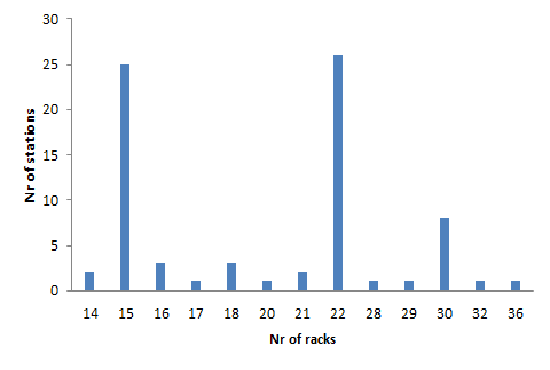
Small and medium-sized stations
The largest station can store 36 bikes, while the smallest has a capacity of 14 bikes.
The average capacity is 20 bikes.
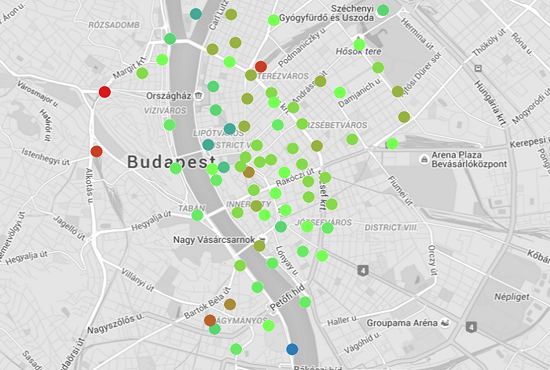
Average utilization of the stations
A key feature of the stations out there are their utilization rate. It is clear that, except for a few stations the average daily utilization rate is around 50%. This value seems to be irrelevant of whether we look at weekdays or weekends.
In contrast, there is a clear relationship between utilization and temperature. During the winter months is the average utilization rate is lower than in the spring months.
Average rent period
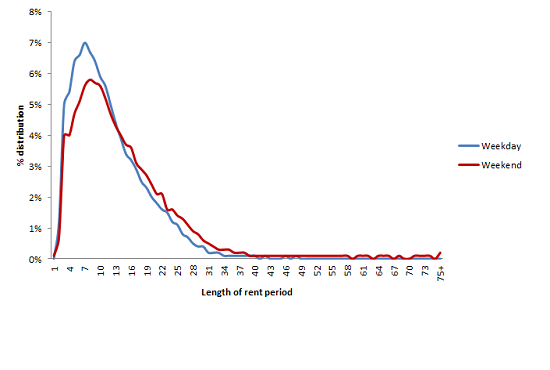
The utilization rate of the stations are closely related to the frequency of the routes in which a station is located. The traffic of the routes are also highly dependent on the average renting period of the bikes. This distribution is found in the left graph. The difference is clear although not highly significant - there is a difference between weekdays and weekends, as people cycle longer on weekends:
- While the average renting period on weekdays is 15 minutes, on weekends this value increases to 21 minutes.
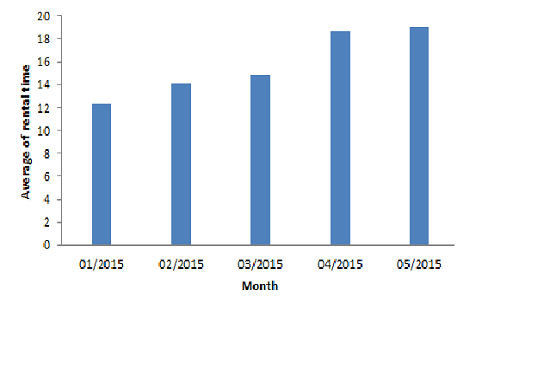
Monthly growth in rental time
There is a difference in the average rental times not only is terms of weekday-weekend split, but also in relation to the weather. It is apparent that in the winter due to low temperatures rental times are shorter, while the spring as weather improves rental times increase.
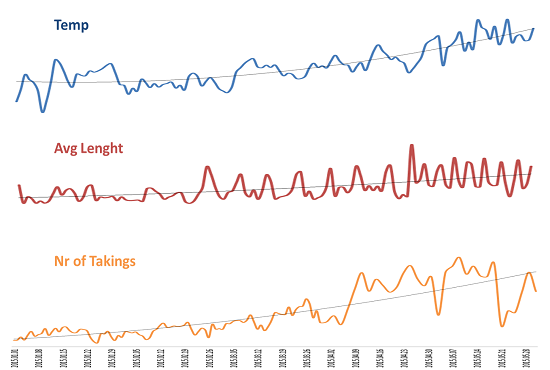
Warmer weather - longer rental times and increase in frequency
The figure in the left confirms the close relationship of rentals with temperature:
The average rental period and the number of bike rentals closely follow the evolution of temperature.
If we look at the entire period, the busiest routes and stations are indicated on the following map:
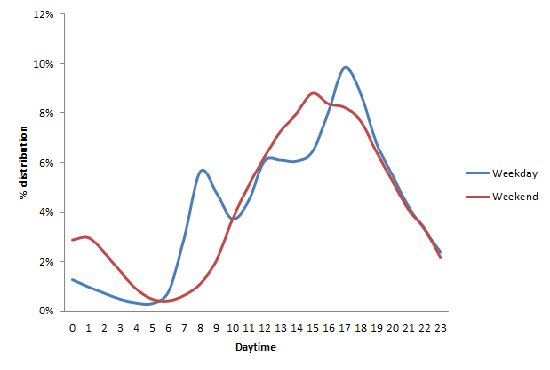
Time-of- day as influencing factor
The effect of weekends does not only impact upon the length of rentals but also has an effect on the split of number of bicycle rentals among the time-of- day. On weekdays the morning and evening hours are more active, whereas on weekends early morning and afternoon hours are when lending is done more.
The following two gif’s compare the averages of a weekday and a weekend. It is clear that on weekends the traffic is concentrated in the inner-city stations, while on weekdays the distribution of traffic is across the entire network mainly due to the users who use it to commute to work (the greener the route the busier)
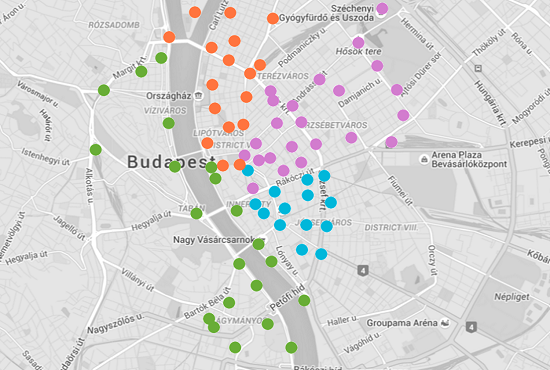
Hidden structure of the routes
By examining the structure of the routes connecting the stations, these relationships give us hints on the entire network structure. We can to divide the network into clear partitions. A partition consists of stations which are similar to each other in some aspect, and are in a stronger relationship with each other.
It is obvious that the Buda stations are distinct from those on the Pest side and that the Pest stations also form three distinct areas that are closely related to each other based on geographical specifics.
The above division into zones - which stem from the specifics of traffic – can be used for example in pricing. A journey inside a zone is free or discounted while outside the zone a higher price could be applied for example.
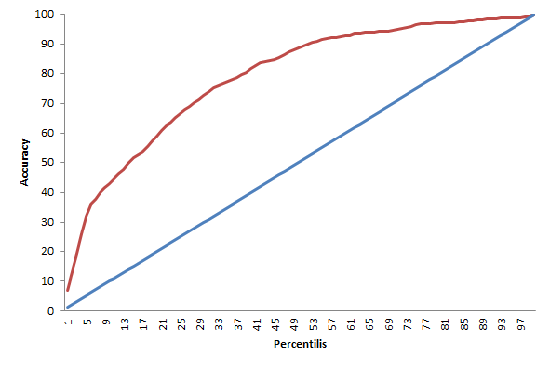
Powerful predictive models
Part of the competition was to create a predictive model based on historical data, which gave the maximum demand on a given station on a given day.
Predictive models' goodness of fit' is best characterized by the lift value, which is defined as follows:
"The lift value is the ratio of confidence and support. It represents the additional information that the model contains as compared to a random expectancy."